LongTerm Rental
Toggle Rental Insights:
Long-Term or Short-Term
- Info was updated
- just now
- Days on Market
- 161
- Views
- N/A
- Saves
- N/A
- Property Estimate
- $111,500
- Return on InvestmentROI
12.02%12.02%
- Long-T Rental Confidence
- LT Rental Confidence
- N/A
- Cap Rate
- 10.5%
- Rent / Price
- 1.38%
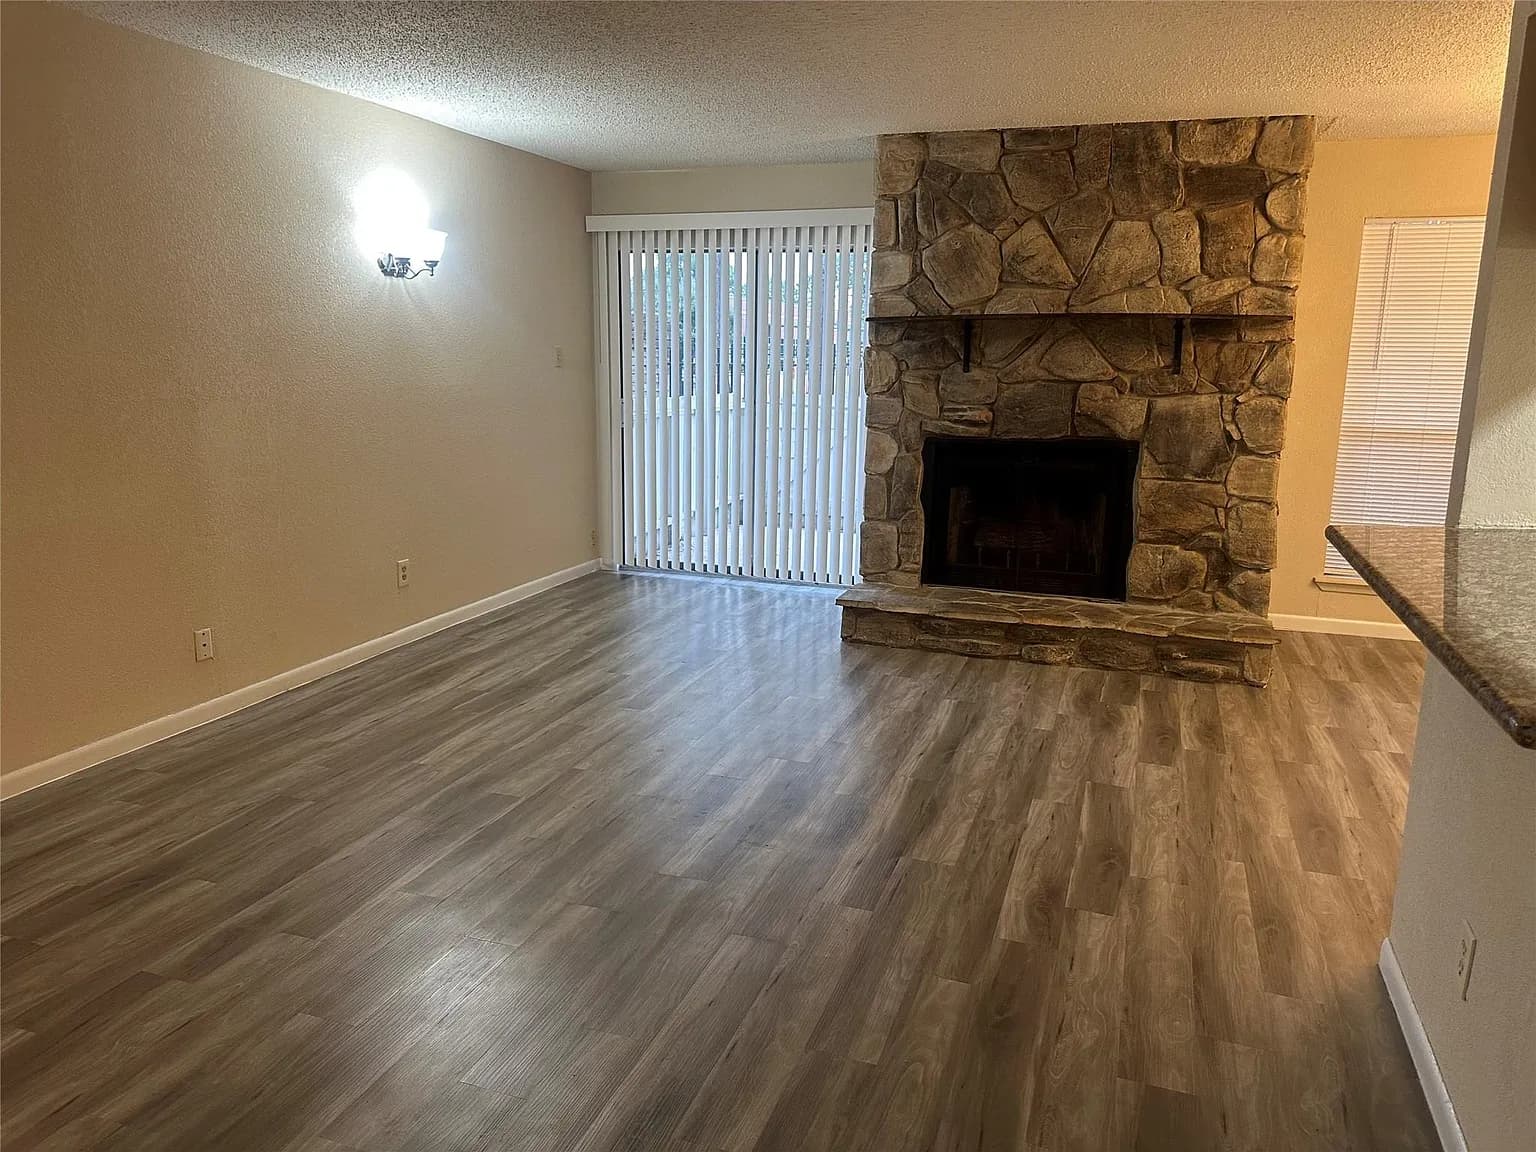
- Address:
- 17401 Red Oak Dr APT 61, Houston, TX 77090
- Property Type
- CONDO
- Area
- 1,134 sqft
- Bed & Bath
- 2bd / 2ba
- Property Condition
- Turn-Key
N
- Contact Realtor
- N/A
Property Report
May take a moment to make the report.
- Research Market
- TX 77090
- Local Property Manager
- N/A
LongTerm Rental
LongTerm Rental
- Area
- 1134 sqft
- Bed
- 2
- Bath
- 2
- Area
- 1134 sqft
- Bed
- 2
- Bath
- 2
Property Details
- HOA Cost
- None
- Year Built
- 1980
- Price Per Square Foot
- $98 /sqft
- Lot Size
- 2 acres
- Property Parking
- N/A
- Public Transport Score
- N/A
- Bike Score
- N/A
- Walkability
- N/A
Seller Description
Schools
- School District:
- N/A
Property Map
Climate Risk
ROI Breakdown
- Return on Investment
12.02%12.02% ROI
- Total Income
- $1,536
- Total Expenses
- $935
- Total Appreciation
- $270,640
Income
Monthly
| Monthly Income | $1,536 |
Total Income
$1,536
Expenses
Monthly
| Mortgage | $376 |
| PMI | $0 |
| Maintenance | $77 |
| Cap Ex | $108 |
| Property Tax | Estimate$149 |
| Property Management | $123 |
| Home Insurance | $39 |
| HOA | $0 |
| Vacancy | $65 |
Total Expenses
$935
Appreciation
30 yrs
| Annual House Appreciation | 3% |
Total Appreciation
$270,640
Return on Investment
30 yrs
| Total Initial Cost | $29,548 |
| Total Expenses | $588,192 |
| Total Appreciation | $270,640 |
| Selling Fee (6%) | $16,238 |
| Total Income | $1,224,601 |
Total ROI
12.02%
Cash-on-Cash
2.03%
Cap Rate
10.51%
Cash Flow
Expense Breakdown
Appreciation Over Time
- Appreciation Rate
- 3%
Income Over Time
- Income Rate
- 5%
Rental Opportunities
Zillow
Long-Term Rental Information
- Average Monthly Revenue
- $1,536
- Average Monthly Expense
- $935
- Monthly Property Tax
- $149
- Estimated Monthly Profit
- $601
- Long-T Rental Confidence
- LT Rental Confidence
- N/A
Airbnb
Short-Term Rental Information
- Average Monthly Rate
- $0
- Average Monthly Expense
- $687
- Average Nightly Rate
- $0
- Average Monthly Occupancy
- 0%
- Estimated Monthly Profit
- -$687
- Short-T Rental Confidence
- ST Rental Confidence
- N/A