- Info was updated
- just now
- Days on Market
- 7
- Views
- N/A
- Saves
- N/A
- Property Estimate
- $150,000
- Return on InvestmentROI
12.27%12.27%
- Long-T Rental Confidence
- LT Rental Confidence
- Very High
- Cap Rate
- 11.3%
- Rent / Price
- 1.45%
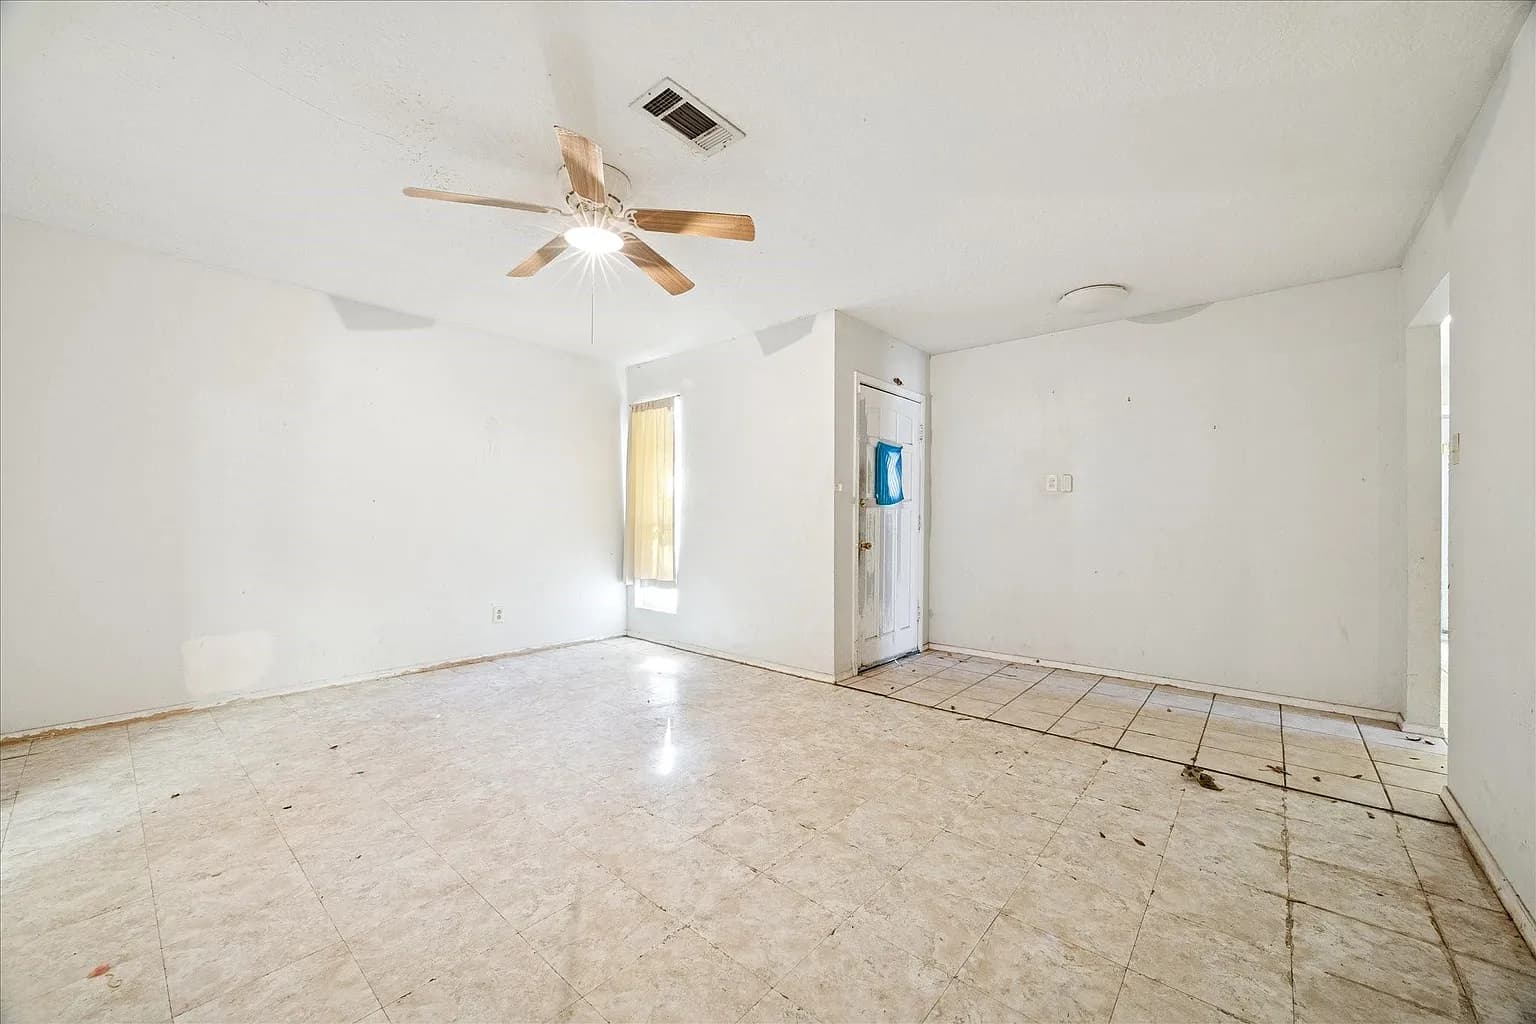
- Address:
- 2402 21st Ave N, Texas City, TX 77590
- Property Type
- Single Family
- Area
- 2,170 sqft
- Bed & Bath
- 4bd / 3ba
- Property Condition
- Turn-Key
N
- Contact Realtor
- N/A
Property Report
May take a moment to make the report.
- Research Market
- TX 77590
- Local Property Manager
- N/A
- Area
- 2170 sqft
- Bed
- 4
- Bath
- 3
Property Details
- HOA Cost
- None
- Year Built
- 1977
- Price Per Square Foot
- $69 /sqft
- Lot Size
- 7,022 sqft
- Property Parking
- N/A
- Public Transport Score
- N/A
- Bike Score
- N/A
- Walkability
- N/A
Seller Description
Schools
- School District:
- N/A
Property Map
ROI Breakdown
- Return on Investment
12.27%12.27% ROI
- Total Income
- $2,177
- Total Expenses
- $1,267
- Total Appreciation
- $364,089
Income
Monthly
| Monthly Income | $2,177 |
Total Income
$2,177
Expenses
Monthly
| Mortgage | $506 |
| PMI | $0 |
| Maintenance | $109 |
| Cap Ex | $152 |
| Property Tax | $182 |
| Property Management | $174 |
| Home Insurance | $53 |
| HOA | $0 |
| Vacancy | $91 |
Total Expenses
$1,267
Appreciation
30 yrs
| Annual House Appreciation | 3% |
Total Appreciation
$364,089
Return on Investment
30 yrs
| Total Initial Cost | $39,750 |
| Total Expenses | $797,858 |
| Total Appreciation | $364,089 |
| Selling Fee (6%) | $21,845 |
| Total Income | $1,735,648 |
Total ROI
12.27%
Cash-on-Cash
2.29%
Cap Rate
11.33%
Cash Flow
Expense Breakdown
Appreciation Over Time
- Appreciation Rate
- 3%
Income Over Time
- Income Rate
- 5%
Rental Opportunities
Zillow
Long-Term Rental Information
- Average Monthly Revenue
- $2,177
- Average Monthly Expense
- $1,267
- Monthly Property Tax
- $182
- Estimated Monthly Profit
- $910
- Long-T Rental Confidence
- LT Rental Confidence
- Very High
Airbnb
Short-Term Rental Information
- Average Monthly Rate
- $2,425
- Average Monthly Expense
- $2,155
- Average Nightly Rate
- $188
- Average Monthly Occupancy
- 43%
- Estimated Monthly Profit
- $270
- Short-T Rental Confidence
- ST Rental Confidence
- N/A