- Info was updated
- just now
- Days on Market
- 38
- Views
- N/A
- Saves
- N/A
- Property Estimate
- $150,000
- Return on InvestmentROI
11.71%11.71%
- Long-T Rental Confidence
- LT Rental Confidence
- Very High
- Cap Rate
- 9.5%
- Rent / Price
- 1.2%
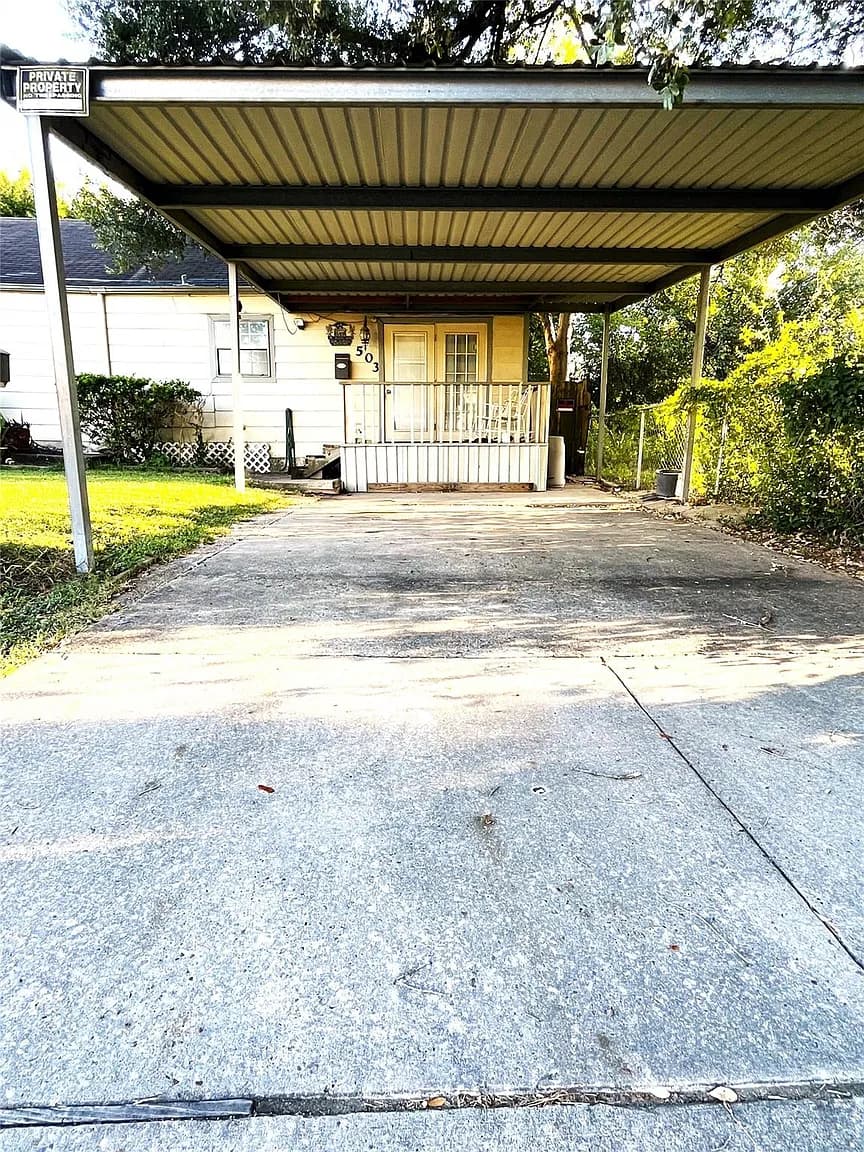
- Address:
- 503 W Pitts Ave, Pasadena, TX 77506
- Property Type
- Single Family
- Area
- 2,176 sqft
- Bed & Bath
- 4bd / 2ba
- Property Condition
- Turn-Key
N
- Contact Realtor
- N/A
Property Report
May take a moment to make the report.
- Research Market
- TX 77506
- Local Property Manager
- N/A
- Area
- 2176 sqft
- Bed
- 4
- Bath
- 2
Property Details
- HOA Cost
- None
- Year Built
- 1941
- Price Per Square Foot
- $69 /sqft
- Lot Size
- 5,001 sqft
- Property Parking
- N/A
- Public Transport Score
- N/A
- Bike Score
- N/A
- Walkability
- N/A
Seller Description
Schools
- School District:
- N/A
Property Map
ROI Breakdown
- Return on Investment
11.71%11.71% ROI
- Total Income
- $1,802
- Total Expenses
- $1,118
- Total Appreciation
- $364,089
Income
Monthly
| Monthly Income | $1,802 |
Total Income
$1,802
Expenses
Monthly
| Mortgage | $506 |
| PMI | $0 |
| Maintenance | $90 |
| Cap Ex | $126 |
| Property Tax | $124 |
| Property Management | $144 |
| Home Insurance | $53 |
| HOA | $0 |
| Vacancy | $76 |
Total Expenses
$1,118
Appreciation
30 yrs
| Annual House Appreciation | 3% |
Total Appreciation
$364,089
Return on Investment
30 yrs
| Total Initial Cost | $39,750 |
| Total Expenses | $678,412 |
| Total Appreciation | $364,089 |
| Selling Fee (6%) | $21,845 |
| Total Income | $1,436,674 |
Total ROI
11.71%
Cash-on-Cash
1.72%
Cap Rate
9.52%
Cash Flow
Expense Breakdown
Appreciation Over Time
- Appreciation Rate
- 3%
Income Over Time
- Income Rate
- 5%
Rental Opportunities
Zillow
Long-Term Rental Information
- Average Monthly Revenue
- $1,802
- Average Monthly Expense
- $1,118
- Monthly Property Tax
- $124
- Estimated Monthly Profit
- $684
- Long-T Rental Confidence
- LT Rental Confidence
- Very High
Airbnb
Short-Term Rental Information
- Average Monthly Rate
- $3,047
- Average Monthly Expense
- $2,417
- Average Nightly Rate
- $169
- Average Monthly Occupancy
- 60%
- Estimated Monthly Profit
- $629
- Short-T Rental Confidence
- ST Rental Confidence
- N/A