LongTerm Rental
Toggle Rental Insights:
Long-Term or Short-Term
- Info was updated
- just now
- Days on Market
- 74
- Views
- N/A
- Saves
- N/A
- Property Estimate
- $129,990
- Return on InvestmentROI
11.53%11.53%
- Long-T Rental Confidence
- LT Rental Confidence
- N/A
- Cap Rate
- 9%
- Rent / Price
- 1.18%
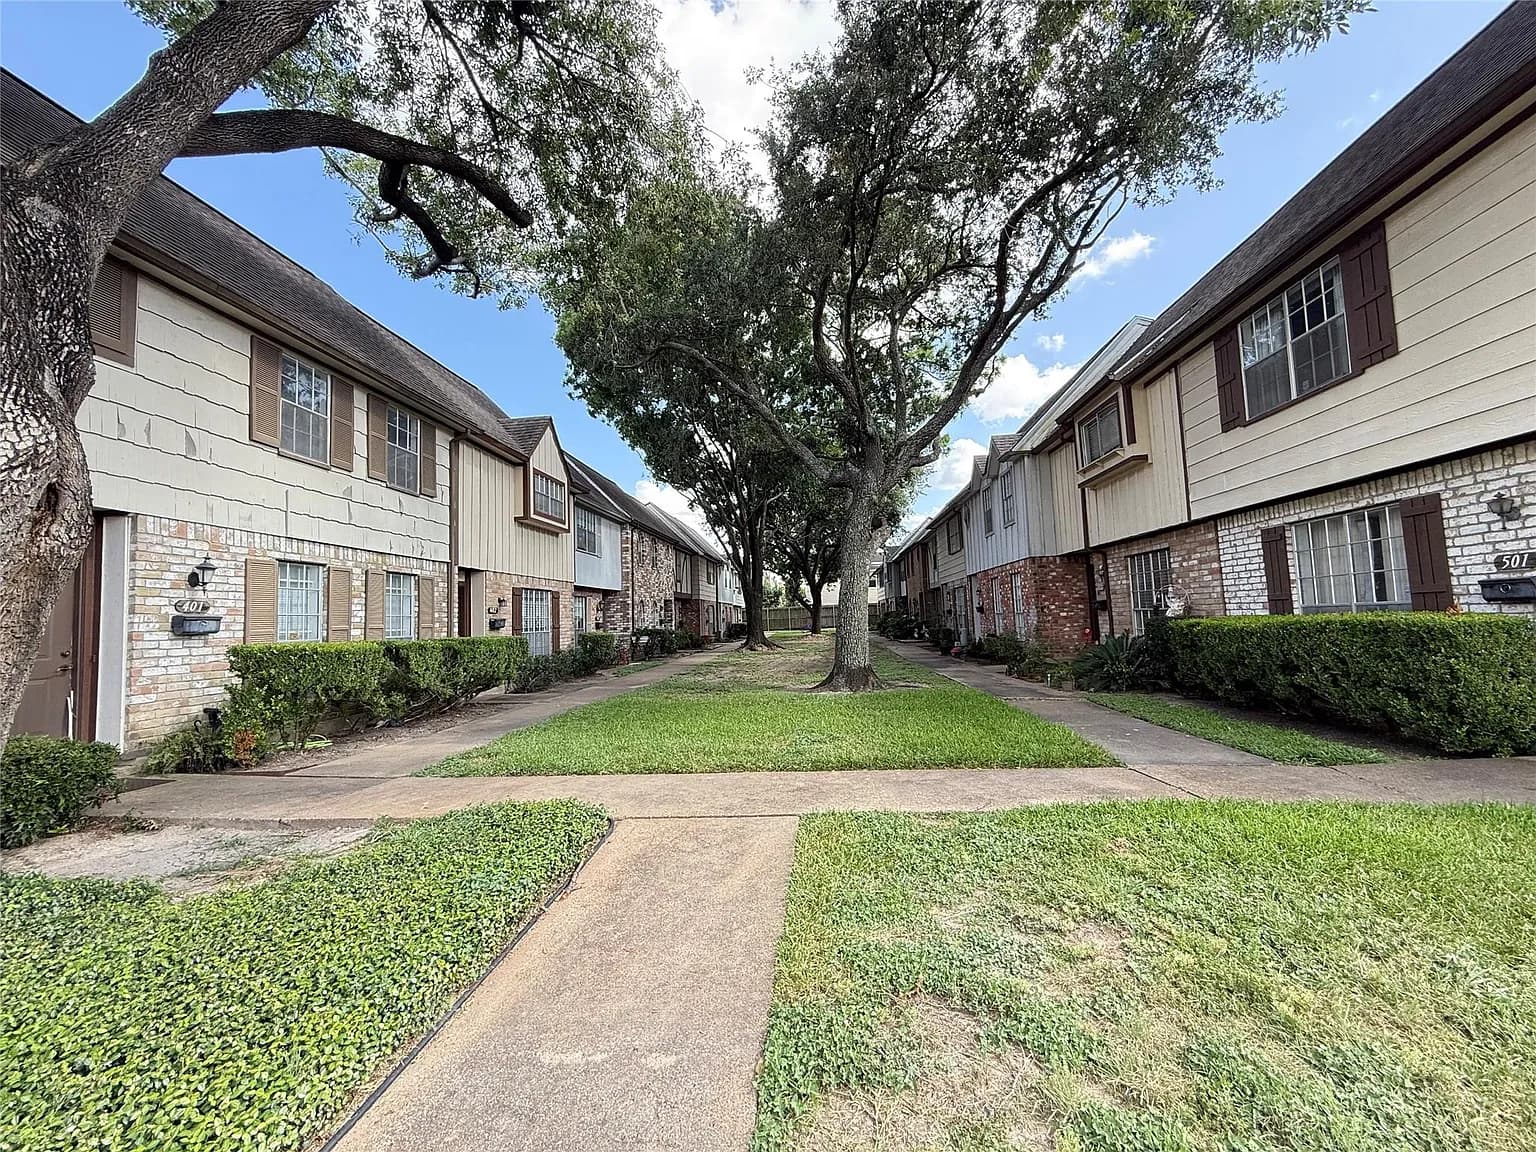
- Address:
- 8101 Amelia Rd APT 507, Houston, TX 77055
- Property Type
- Townhouse
- Area
- 1,269 sqft
- Bed & Bath
- 2bd / 2ba
- Property Condition
- Fixer-Upper
N
- Contact Realtor
- N/A
Property Report
May take a moment to make the report.
- Research Market
- TX 77055
- Local Property Manager
- N/A
LongTerm Rental
LongTerm Rental
- Area
- 1269 sqft
- Bed
- 2
- Bath
- 2
- Area
- 1269 sqft
- Bed
- 2
- Bath
- 2
Property Details
- HOA Cost
- None
- Year Built
- 1977
- Price Per Square Foot
- $102 /sqft
- Lot Size
- 2 acres
- Property Parking
- N/A
- Public Transport Score
- N/A
- Bike Score
- N/A
- Walkability
- N/A
Seller Description
Schools
- School District:
- N/A
Property Map
Climate Risk
ROI Breakdown
- Return on Investment
11.53%11.53% ROI
- Total Income
- $1,538
- Total Expenses
- $999
- Total Appreciation
- $315,520
Income
Monthly
| Monthly Income | $1,538 |
Total Income
$1,538
Expenses
Monthly
| Mortgage | $438 |
| PMI | $0 |
| Maintenance | $77 |
| Cap Ex | $108 |
| Property Tax | $143 |
| Property Management | $123 |
| Home Insurance | $45 |
| HOA | $0 |
| Vacancy | $65 |
Total Expenses
$999
Appreciation
30 yrs
| Annual House Appreciation | 3% |
Total Appreciation
$315,520
Return on Investment
30 yrs
| Total Initial Cost | $34,447 |
| Total Expenses | $612,541 |
| Total Appreciation | $315,520 |
| Selling Fee (6%) | $18,931 |
| Total Income | $1,226,195 |
Total ROI
11.53%
Cash-on-Cash
1.56%
Cap Rate
9.02%
Cash Flow
Expense Breakdown
Appreciation Over Time
- Appreciation Rate
- 3%
Income Over Time
- Income Rate
- 5%
Rental Opportunities
Zillow
Long-Term Rental Information
- Average Monthly Revenue
- $1,538
- Average Monthly Expense
- $999
- Monthly Property Tax
- $143
- Estimated Monthly Profit
- $539
- Long-T Rental Confidence
- LT Rental Confidence
- N/A
Airbnb
Short-Term Rental Information
- Average Monthly Rate
- $1,946
- Average Monthly Expense
- $1,773
- Average Nightly Rate
- $107
- Average Monthly Occupancy
- 61%
- Estimated Monthly Profit
- $173
- Short-T Rental Confidence
- ST Rental Confidence
- N/A