LongTerm Rental
Toggle Rental Insights:
Long-Term or Short-Term
- Info was updated
- just now
- Days on Market
- 88
- Views
- N/A
- Saves
- N/A
- Property Estimate
- $125,000
- Return on InvestmentROI
11.23%11.23%
- Long-T Rental Confidence
- LT Rental Confidence
- N/A
- Cap Rate
- 8.2%
- Rent / Price
- 1.09%
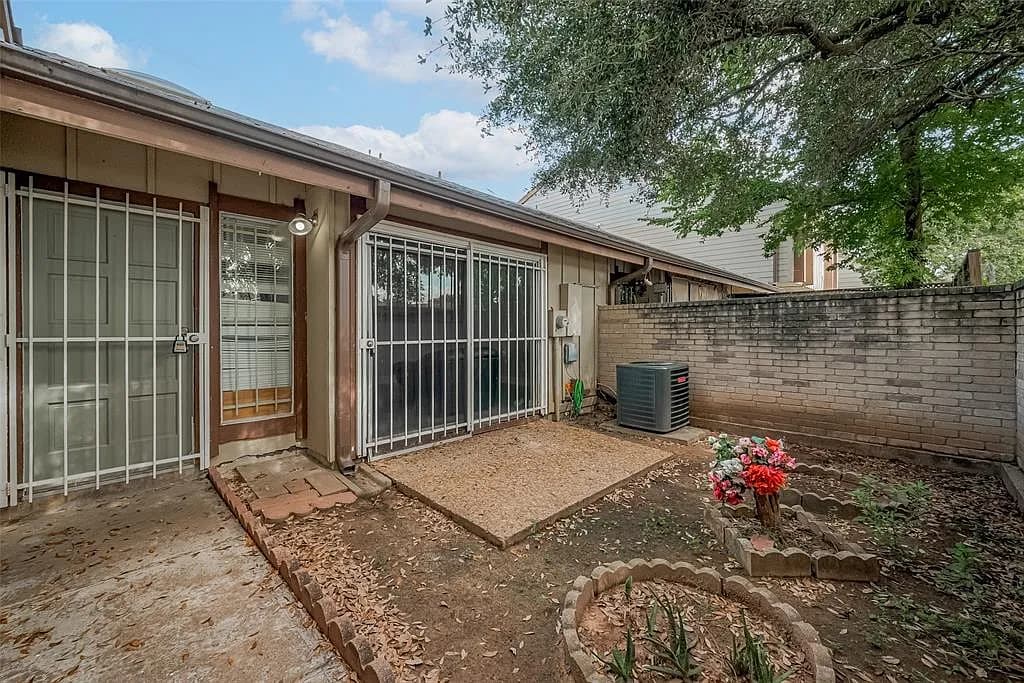
- Address:
- 8612 Dairy View Ln, Houston, TX 77072
- Property Type
- Townhouse
- Area
- 833 sqft
- Bed & Bath
- 2bd / 2ba
- Property Condition
- Lightly-Renovated
N
- Contact Realtor
- N/A
Property Report
May take a moment to make the report.
- Research Market
- TX 77072
- Local Property Manager
- N/A
LongTerm Rental
LongTerm Rental
- Area
- 833 sqft
- Bed
- 2
- Bath
- 2
- Area
- 833 sqft
- Bed
- 2
- Bath
- 2
Property Details
- HOA Cost
- None
- Year Built
- 1977
- Price Per Square Foot
- $150 /sqft
- Lot Size
- 1,873 sqft
- Property Parking
- N/A
- Public Transport Score
- N/A
- Bike Score
- N/A
- Walkability
- N/A
Seller Description
Schools
- School District:
- N/A
Property Map
Climate Risk
ROI Breakdown
- Return on Investment
11.23%11.23% ROI
- Total Income
- $1,357
- Total Expenses
- $924
- Total Appreciation
- $303,408
Income
Monthly
| Monthly Income | $1,357 |
Total Income
$1,357
Expenses
Monthly
| Mortgage | $422 |
| PMI | $0 |
| Maintenance | $68 |
| Cap Ex | $95 |
| Property Tax | $130 |
| Property Management | $109 |
| Home Insurance | $44 |
| HOA | $0 |
| Vacancy | $57 |
Total Expenses
$924
Appreciation
30 yrs
| Annual House Appreciation | 3% |
Total Appreciation
$303,408
Return on Investment
30 yrs
| Total Initial Cost | $33,125 |
| Total Expenses | $559,633 |
| Total Appreciation | $303,408 |
| Selling Fee (6%) | $18,204 |
| Total Income | $1,081,890 |
Total ROI
11.23%
Cash-on-Cash
1.31%
Cap Rate
8.2%
Cash Flow
Expense Breakdown
Appreciation Over Time
- Appreciation Rate
- 3%
Income Over Time
- Income Rate
- 5%
Rental Opportunities
Zillow
Long-Term Rental Information
- Average Monthly Revenue
- $1,357
- Average Monthly Expense
- $924
- Monthly Property Tax
- $130
- Estimated Monthly Profit
- $433
- Long-T Rental Confidence
- LT Rental Confidence
- N/A
Airbnb
Short-Term Rental Information
- Average Monthly Rate
- $0
- Average Monthly Expense
- $734
- Average Nightly Rate
- $0
- Average Monthly Occupancy
- 0%
- Estimated Monthly Profit
- -$734
- Short-T Rental Confidence
- ST Rental Confidence
- N/A