- Info was updated
- just now
- Days on Market
- 15
- Views
- N/A
- Saves
- N/A
- Property Estimate
- $105,000
- Return on InvestmentROI
12.15%12.15%
- Long-T Rental Confidence
- LT Rental Confidence
- Very High
- Cap Rate
- 10.9%
- Rent / Price
- 1.28%
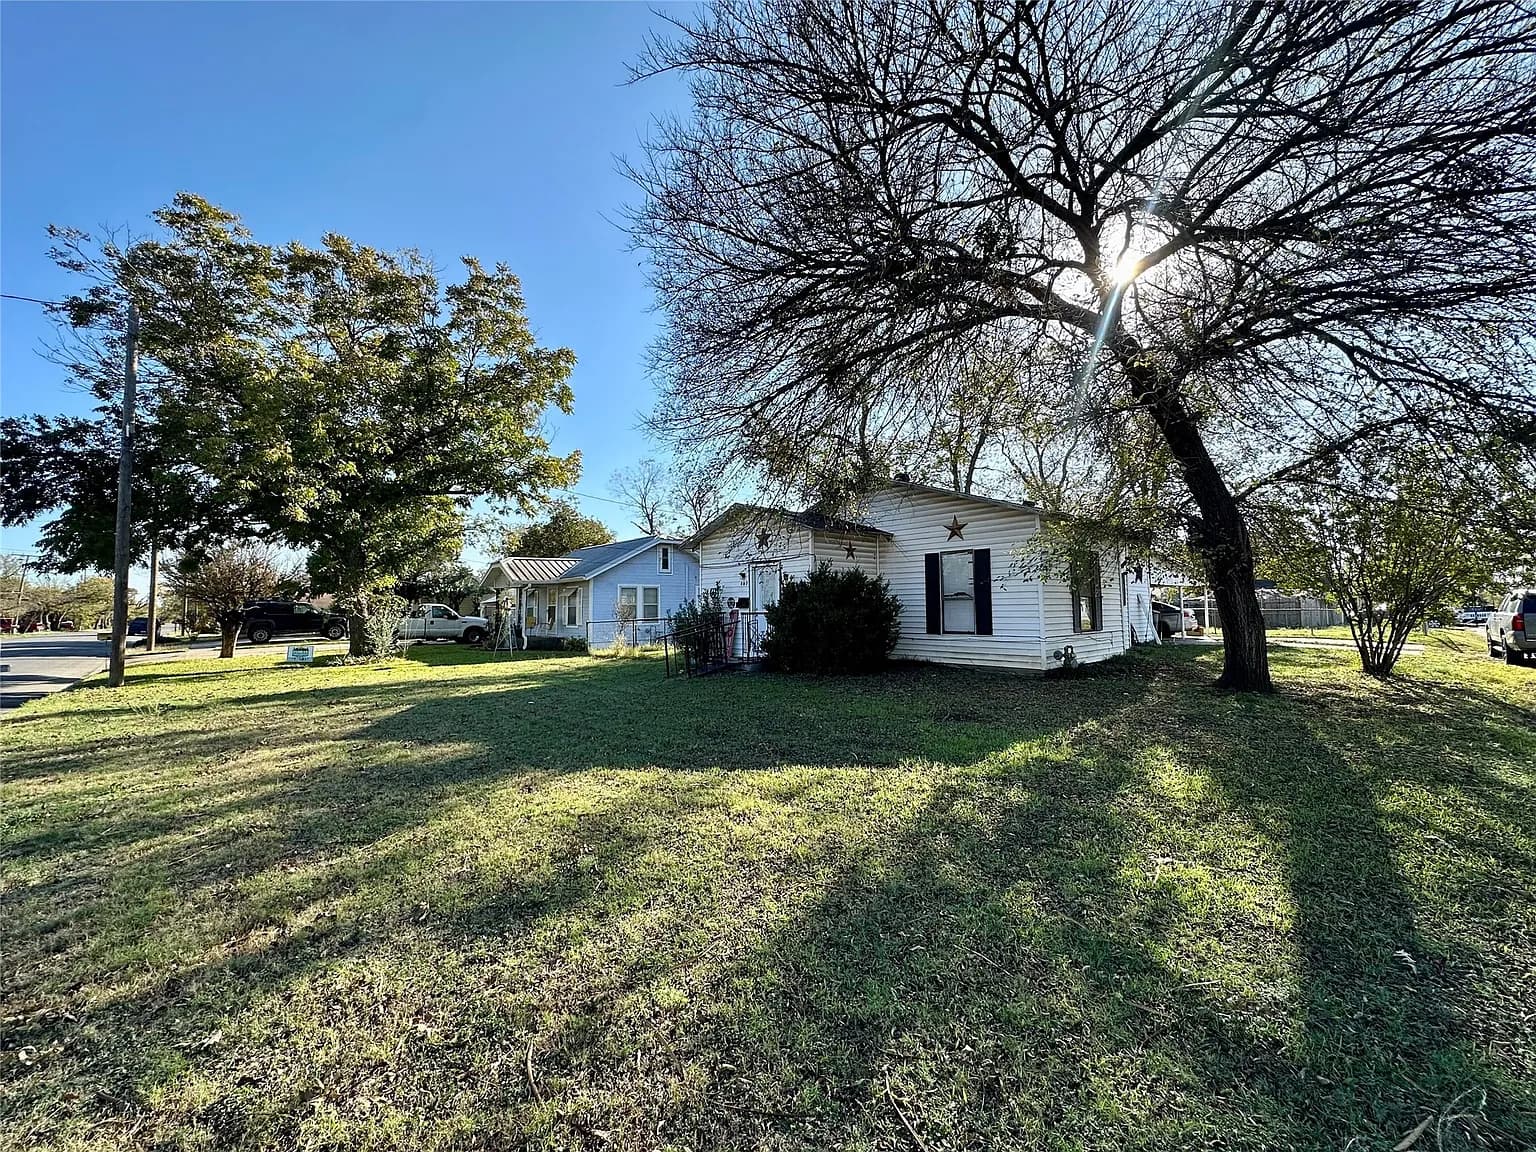
- Address:
- 407 Erie St, Cleburne, TX 76031
- Property Type
- Single Family
- Area
- 966 sqft
- Bed & Bath
- 2bd / 1ba
- Property Condition
- Turn-Key
N
- Contact Realtor
- N/A
Property Report
May take a moment to make the report.
- Research Market
- TX 76031
- Local Property Manager
- N/A
- Area
- 966 sqft
- Bed
- 2
- Bath
- 1
Property Details
- HOA Cost
- None
- Year Built
- 1920
- Price Per Square Foot
- $109 /sqft
- Lot Size
- 10,106 sqft
- Property Parking
- N/A
- Public Transport Score
- N/A
- Bike Score
- N/A
- Walkability
- N/A
Seller Description
Schools
- School District:
- N/A
Property Map
ROI Breakdown
- Return on Investment
12.15%12.15% ROI
- Total Income
- $1,340
- Total Expenses
- $741
- Total Appreciation
- $254,863
Income
Monthly
| Monthly Income | $1,340 |
Total Income
$1,340
Expenses
Monthly
| Mortgage | $354 |
| PMI | $0 |
| Maintenance | $67 |
| Cap Ex | $94 |
| Property Tax | $26 |
| Property Management | $107 |
| Home Insurance | $37 |
| HOA | $0 |
| Vacancy | $56 |
Total Expenses
$741
Appreciation
30 yrs
| Annual House Appreciation | 3% |
Total Appreciation
$254,863
Return on Investment
30 yrs
| Total Initial Cost | $27,825 |
| Total Expenses | $440,600 |
| Total Appreciation | $254,863 |
| Selling Fee (6%) | $15,292 |
| Total Income | $1,068,337 |
Total ROI
12.15%
Cash-on-Cash
2.15%
Cap Rate
10.9%
Cash Flow
Expense Breakdown
Appreciation Over Time
- Appreciation Rate
- 3%
Income Over Time
- Income Rate
- 5%
Rental Opportunities
Zillow
Long-Term Rental Information
- Average Monthly Revenue
- $1,340
- Average Monthly Expense
- $741
- Monthly Property Tax
- $26
- Estimated Monthly Profit
- $599
- Long-T Rental Confidence
- LT Rental Confidence
- Very High
Airbnb
Short-Term Rental Information
- Average Monthly Rate
- $1,732
- Average Monthly Expense
- $1,425
- Average Nightly Rate
- $121
- Average Monthly Occupancy
- 48%
- Estimated Monthly Profit
- $307
- Short-T Rental Confidence
- ST Rental Confidence
- N/A