LongTerm Rental
Toggle Rental Insights:
Long-Term or Short-Term
- Info was updated
- just now
- Days on Market
- 44
- Views
- N/A
- Saves
- N/A
- Property Estimate
- $472,000
- Return on InvestmentROI
11.07%11.07%
- Long-T Rental Confidence
- LT Rental Confidence
- N/A
- Cap Rate
- 7.8%
- Rent / Price
- 1.06%
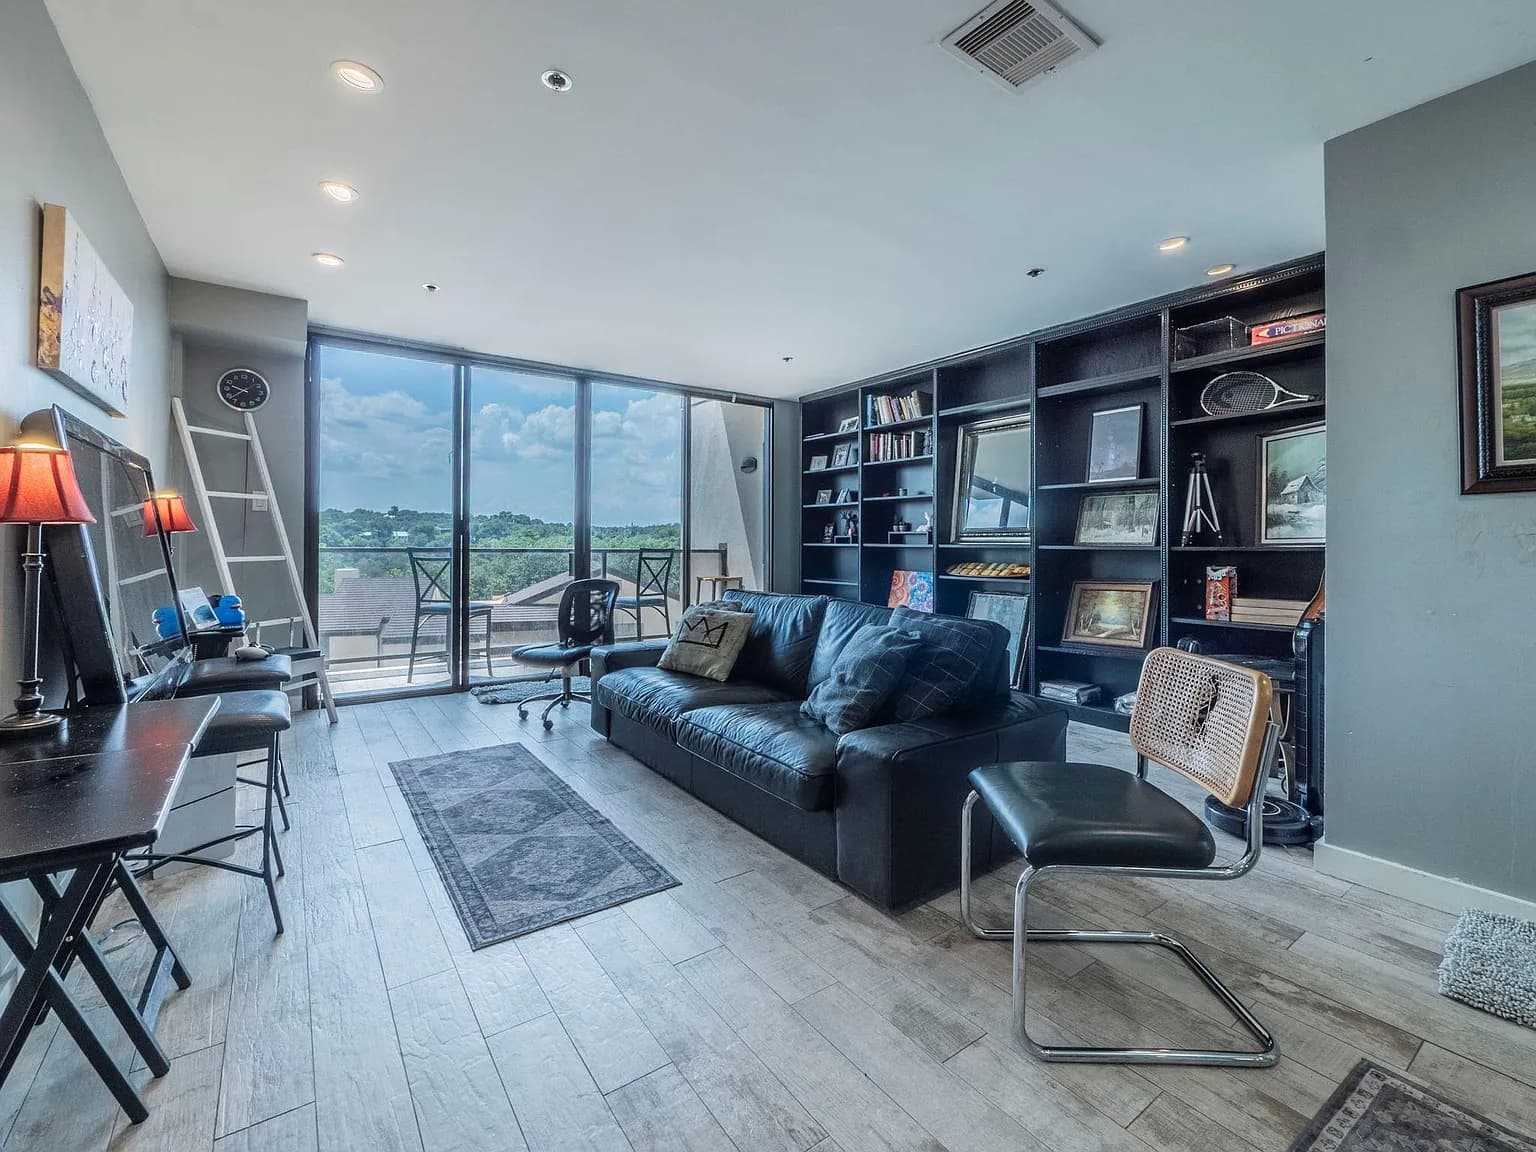
- Address:
- 40 N Interstate Highway 35 Hwy #4A4, Austin, TX 78701
- Property Type
- CONDO
- Area
- 1,234 sqft
- Bed & Bath
- 2bd / 2ba
- Property Condition
- Turn-Key
N
- Contact Realtor
- N/A
Property Report
May take a moment to make the report.
- Research Market
- TX 78701
- Local Property Manager
- N/A
LongTerm Rental
LongTerm Rental
- Area
- 1234 sqft
- Bed
- 2
- Bath
- 2
- Area
- 1234 sqft
- Bed
- 2
- Bath
- 2
Property Details
- HOA Cost
- None
- Year Built
- 1983
- Price Per Square Foot
- $382 /sqft
- Lot Size
- 967 sqft
- Property Parking
- N/A
- Public Transport Score
- N/A
- Bike Score
- N/A
- Walkability
- N/A
Seller Description
Schools
- School District:
- N/A
Property Map
Climate Risk
ROI Breakdown
- Return on Investment
11.07%11.07% ROI
- Total Income
- $4,986
- Total Expenses
- $3,513
- Total Appreciation
- $1,145,668
Income
Monthly
| Monthly Income | $4,986 |
Total Income
$4,986
Expenses
Monthly
| Mortgage | $1,592 |
| PMI | $0 |
| Maintenance | $249 |
| Cap Ex | $349 |
| Property Tax | $550 |
| Property Management | $399 |
| Home Insurance | $165 |
| HOA | $0 |
| Vacancy | $209 |
Total Expenses
$3,513
Appreciation
30 yrs
| Annual House Appreciation | 3% |
Total Appreciation
$1,145,668
Return on Investment
30 yrs
| Total Initial Cost | $125,080 |
| Total Expenses | $2,132,781 |
| Total Appreciation | $1,145,668 |
| Selling Fee (6%) | $68,740 |
| Total Income | $3,975,169 |
Total ROI
11.07%
Cash-on-Cash
1.18%
Cap Rate
7.79%
Cash Flow
Expense Breakdown
Appreciation Over Time
- Appreciation Rate
- 3%
Income Over Time
- Income Rate
- 5%
Rental Opportunities
Zillow
Long-Term Rental Information
- Average Monthly Revenue
- $4,986
- Average Monthly Expense
- $3,513
- Monthly Property Tax
- $550
- Estimated Monthly Profit
- $1,473
- Long-T Rental Confidence
- LT Rental Confidence
- N/A
Airbnb
Short-Term Rental Information
- Average Monthly Rate
- $6,609
- Average Monthly Expense
- $6,234
- Average Nightly Rate
- $331
- Average Monthly Occupancy
- 67%
- Estimated Monthly Profit
- $376
- Short-T Rental Confidence
- ST Rental Confidence
- N/A