LongTerm Rental
Toggle Rental Insights:
Long-Term or Short-Term
- Info was updated
- just now
- Days on Market
- 73
- Views
- N/A
- Saves
- N/A
- Property Estimate
- $159,000
- Return on InvestmentROI
11.1%11.1%
- Long-T Rental Confidence
- LT Rental Confidence
- N/A
- Cap Rate
- 7.9%
- Rent / Price
- 1.04%
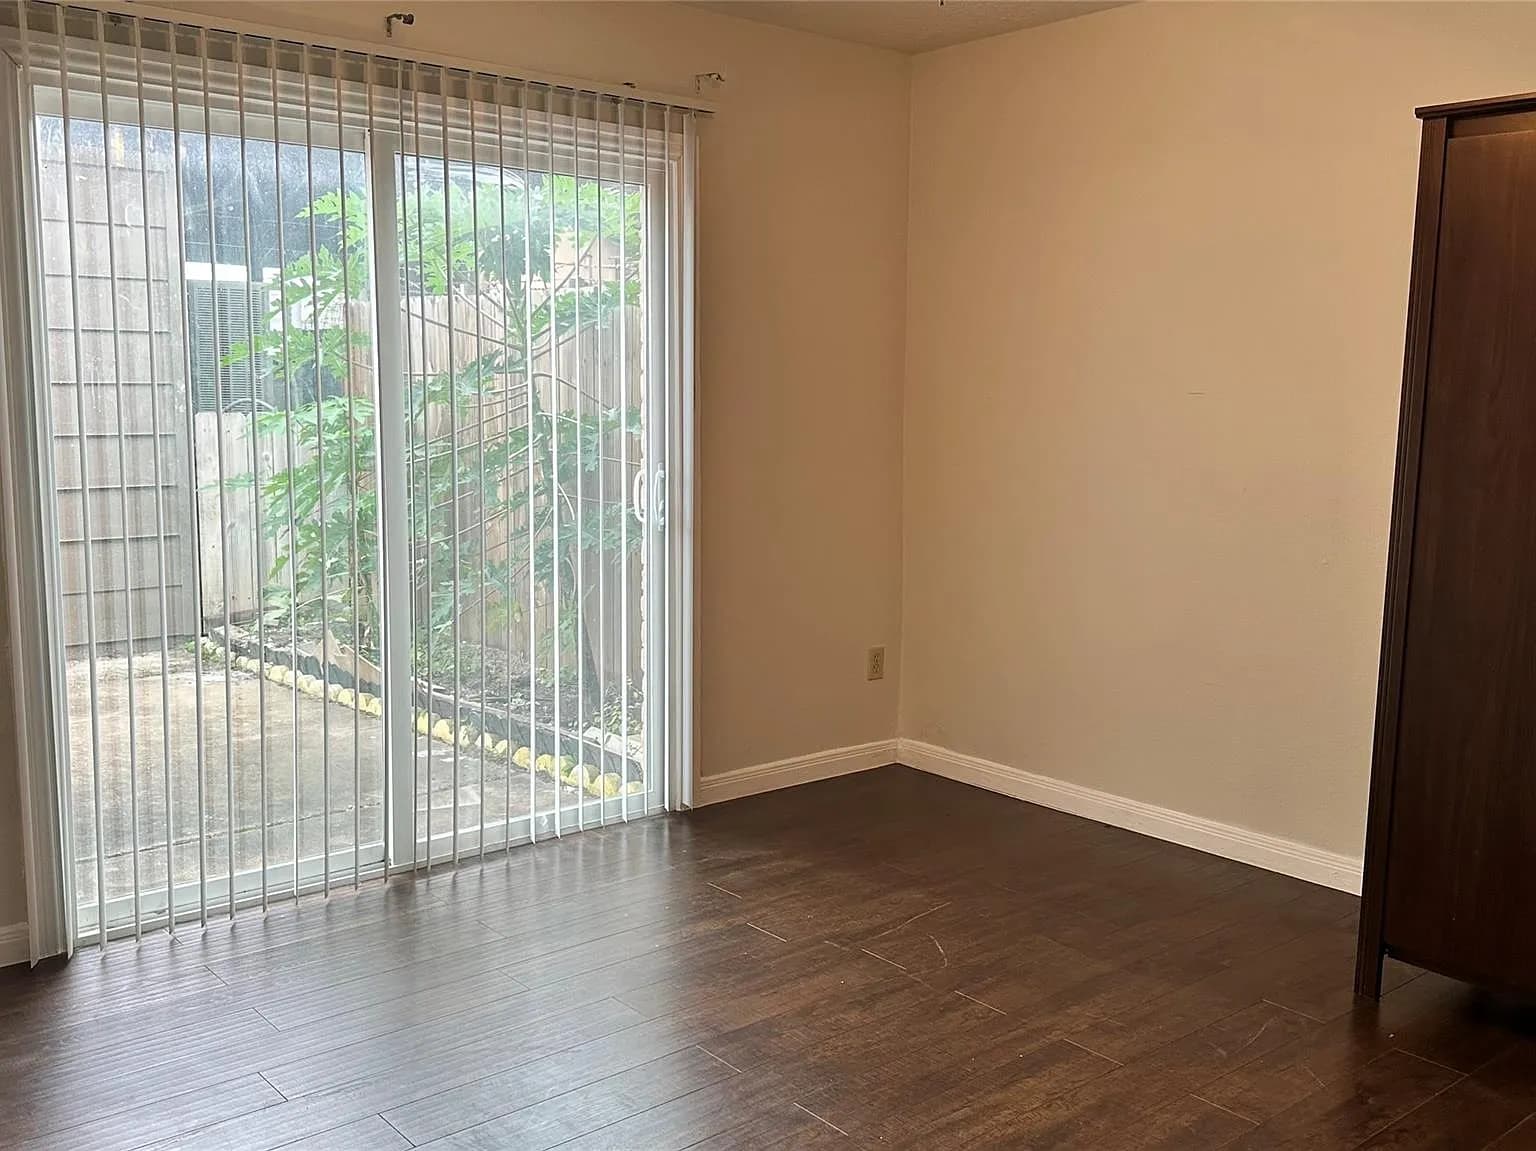
- Address:
- 7204 Crownwest St #7204, Houston, TX 77072
- Property Type
- Townhouse
- Area
- 1,584 sqft
- Bed & Bath
- 3bd / 3ba
- Property Condition
- Turn-Key
A
- Contact Realtor
- Angel Lopez
Property Report
May take a moment to make the report.
- Research Market
- TX 77072
- Local Property Manager
- HomeSmart
LongTerm Rental
LongTerm Rental
- Area
- 1584 sqft
- Bed
- 3
- Bath
- 3
- Area
- 1584 sqft
- Bed
- 3
- Bath
- 3
Property Details
- HOA Cost
- None
- Year Built
- 1971
- Price Per Square Foot
- $100 /sqft
- Lot Size
- 1,564 sqft
- Property Parking
- N/A
- Public Transport Score
- N/A
- Bike Score
- N/A
- Walkability
- N/A
Seller Description
Schools
- School District:
- N/A
Property Map
Climate Risk
ROI Breakdown
- Return on Investment
11.1%11.1% ROI
- Total Income
- $1,656
- Total Expenses
- $1,150
- Total Appreciation
- $385,935
Income
Monthly
| Monthly Income | $1,656 |
Total Income
$1,656
Expenses
Monthly
| Mortgage | $536 |
| PMI | $0 |
| Maintenance | $83 |
| Cap Ex | $116 |
| Property Tax | $158 |
| Property Management | $132 |
| Home Insurance | $56 |
| HOA | $0 |
| Vacancy | $70 |
Total Expenses
$1,150
Appreciation
30 yrs
| Annual House Appreciation | 3% |
Total Appreciation
$385,935
Return on Investment
30 yrs
| Total Initial Cost | $42,135 |
| Total Expenses | $691,518 |
| Total Appreciation | $385,935 |
| Selling Fee (6%) | $23,156 |
| Total Income | $1,320,273 |
Total ROI
11.1%
Cash-on-Cash
1.2%
Cap Rate
7.86%
Cash Flow
Expense Breakdown
Appreciation Over Time
- Appreciation Rate
- 3%
Income Over Time
- Income Rate
- 5%
Rental Opportunities
Zillow
Long-Term Rental Information
- Average Monthly Revenue
- $1,656
- Average Monthly Expense
- $1,150
- Monthly Property Tax
- $158
- Estimated Monthly Profit
- $506
- Long-T Rental Confidence
- LT Rental Confidence
- N/A
Airbnb
Short-Term Rental Information
- Average Monthly Rate
- $3,050
- Average Monthly Expense
- $2,496
- Average Nightly Rate
- $211
- Average Monthly Occupancy
- 49%
- Estimated Monthly Profit
- $553
- Short-T Rental Confidence
- ST Rental Confidence
- N/A